一、简介
1.1 Spring Cloud Hystrix
在分布式系统中,由于服务之间相互的依赖调用,如果一个服务单元发生了故障就有可能导致故障蔓延至整个系统,从而衍生出一系列的保护机制,断路器就是其中之一。
断路器可以在服务单元发生故障的时候,及时切断与服务单元的连接,避免资源被长时间占用。Spring Cloud Hystrix 组件实现了断路器、线程隔离等一系列基本功能,并具有服务降级、服务熔断、请求缓存、请求合并以及服务监控等配套功能。
1.2 熔断器工作机制
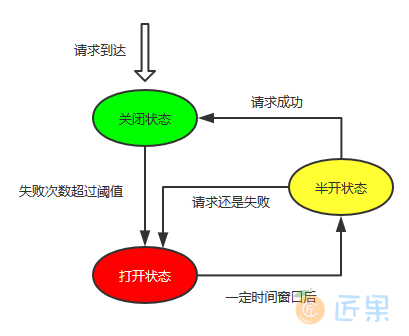
- 当一个服务处理请求失败的次数低于阈值时,熔断器处于关闭状态,服务正常;
- 当一个服务处理请求失败的次数大于阈值时,熔断器开启,这时所有的请求都会执行快速失败,而不会去调用实际的服务;
- 当熔断器处于打开状态的一段时间后,熔断器处于半打开状态,这时候一定数量的请求回去调用实际的服务,如果调用成功,则代表服务可用了,熔断器关闭;如果还是失败,则代表服务还是不可用,熔断器继续打开。
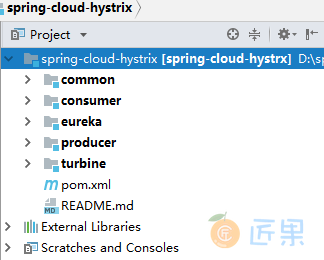
二、项目结构
spring-cloud-ribbon 用例已经实现通过 Ribbon + RestTemplate 实现服务间的调用,本用例在其基础上进行 Hystrix 的整合:
- common :公共的接口和实体类;
- consumer :服务的消费者,采用 RestTemplate 调用产品服务;
- producer :服务的提供者;
- eureka : 注册中心;
- turbine :多个熔断器的聚合监控。
三、整合 Hystrix
这里以 consumer 模块为例,说明其整合步骤:
3.1 引入依赖
Hystrix 的仪表盘功能实际上是从 端点 获取数据,所以需要引入 actuator starter 开启端点的相关功能:
<!--hystrix 依赖-->
<dependency>
    <groupId>org.springframework.cloud</groupId>
    <artifactId>spring-cloud-starter-netflix-hystrix</artifactId>
</dependency>
<!--hystrix 监控仪表盘依赖-->
<dependency>
    <groupId>org.springframework.cloud</groupId>
    <artifactId>spring-cloud-starter-netflix-hystrix-dashboard</artifactId>
</dependency>
<!--健康检查依赖-->
<dependency>
    <groupId>org.springframework.boot</groupId>
    <artifactId>spring-boot-starter-actuator</artifactId>
</dependency>
3.2 暴露端点
management:
  endpoints:
    web:
      exposure:
        # 需要开启 hystrix.stream 端点的暴露 这样才能获取到监控信息 * 代表开启所有可监控端点
        include: "*"
3.3 添加注解
在启动类上添加注解 @EnableHystrix 和 @EnableHystrixDashboard:
@SpringBootApplication
@EnableDiscoveryClient
@EnableHystrix
@EnableHystrixDashboard
public class ConsumerApplication {
    public static void main(String[] args) {
        SpringApplication.run(ConsumerApplication.class, args);
    }
}
3.4 服务降级
使用 @HystrixCommand 定义失败回退的方法:
@HystrixCommand(fallbackMethod = "queryProductsFail")
public List<Product> queryAllProducts() {
    ResponseEntity<List> responseEntity = restTemplate.getForEntity("http://producer/products", List.class);
    List<Product> productList = responseEntity.getBody();
    return productList;
}
// 如果发送熔断返回空集合,在前端判断处理
public List<Product> queryProductsFail() {
    return new ArrayList<>();
}
<!doctype html>
<html lang="en">
<head>
<title>产品列表</title>
</head>
<body>
<h3>产品列表:点击查看详情</h3>
<form action="/sell/product" method="post">
<input type="text" name="productName">
<input type="submit" value="新增产品">
</form>
<ul>
<#if (products?size>0) >
<#list products as product>
<li>
<a href="/sell/product/${product.id}">${product.name}</a>
</li>
</#list>
<#else>
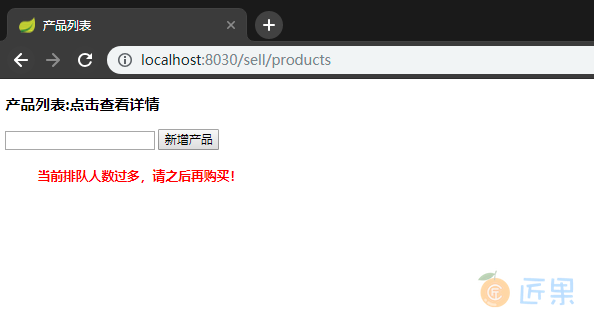
<h4 style="color: red">当前排队人数过多,请之后再购买!</h4>
</#if>
</ul>
</body>
</html>
3.5 模拟熔断
这里被调用方采用线程休眠的方式模拟服务超时,Hystrix 默认超时时间为 2s,调用远程服务时候超过这个时间,会触发熔断:
public List<Product> queryAllProducts() {
    // hystrix 默认超时是 2 秒
    int i = new Random().nextInt(2500);
    try {
        Thread.sleep(i);
    } catch (InterruptedException e) {
        e.printStackTrace();
    }
    return productList;
}
3.5 测试熔断
启动服务,访问 http://localhost:8030/sell/products ,多次刷新查看熔断情况:
3.7 控制台
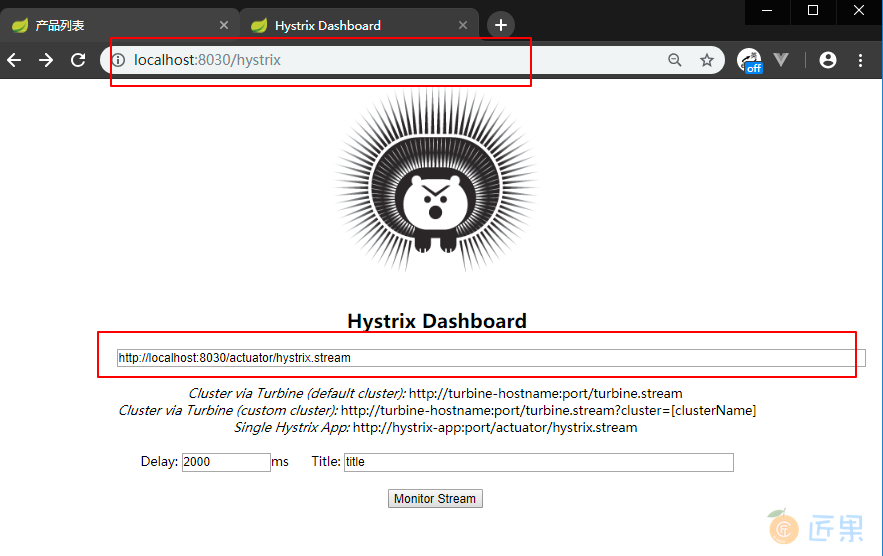
启动服务后,可以访问 localhost:8030/hystrix ,依次输出 http://localhost:8030/actuator/hystrix.stream(监控地址) ,2000(延迟时间),title 可以任意填写,进入Hystrix 监控台。
在 Spring Cloud Finchley.SR2 中,监控地址需要以 /actuator 开头的,因为在 Spring Boot 2.x 中所有端点(包括自定义端点)都是暴露在这个路径下,可以通过控制台的启动日志来验证这一点。
登录页面 :
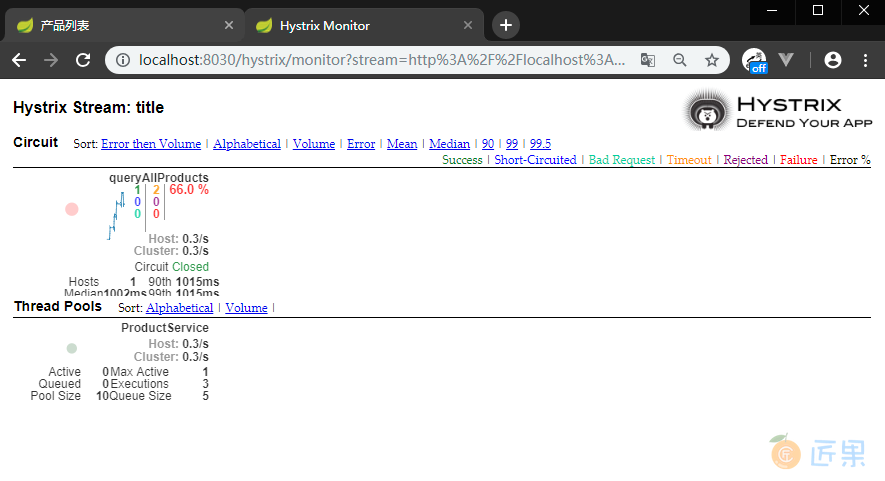
监控页面 :
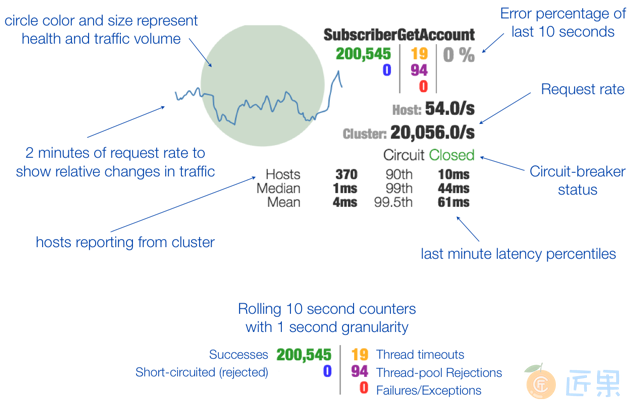
关于各个参数的说明参见官方 wiki 提供的图 :
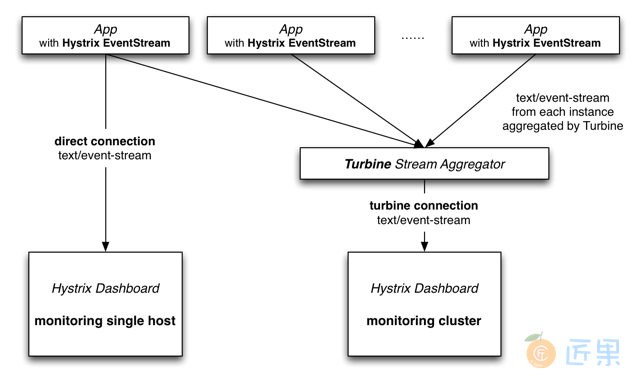
四、聚合监控
如果你想要聚合监控不同服务单元下的多个断路器,可以使用 Turbine 来实现。单体监控和聚合监控的区别如下:
4.1 导入依赖
创建 Turbine 模块,导入以下依赖:
<?xml version="1.0" encoding="UTF-8"?>
<project xmlns="http://maven.apache.org/POM/4.0.0" xmlns:xsi="http://www.w3.org/2001/XMLSchema-instance"
         xsi:schemaLocation="http://maven.apache.org/POM/4.0.0 http://maven.apache.org/xsd/maven-4.0.0.xsd">
    <modelVersion>4.0.0</modelVersion>
    <parent>
        <groupId>com.heibaiying.hystrix</groupId>
        <artifactId>spring-cloud-hystrx</artifactId>
        <version>0.0.1-SNAPSHOT</version>
    </parent>
    <artifactId>turbine</artifactId>
    <dependencies>
        <dependency>
            <groupId>org.springframework.cloud</groupId>
            <artifactId>spring-cloud-starter-netflix-eureka-client</artifactId>
        </dependency>
           <dependency>
            <groupId>org.springframework.boot</groupId>
            <artifactId>spring-boot-starter-actuator</artifactId>
        </dependency>
        <dependency>
            <groupId>org.springframework.cloud</groupId>
            <artifactId>spring-cloud-starter-netflix-hystrix</artifactId>
        </dependency>
        <dependency>
            <groupId>org.springframework.cloud</groupId>
            <artifactId>spring-cloud-starter-netflix-hystrix-dashboard</artifactId>
        </dependency>
        <dependency>
            <groupId>org.springframework.cloud</groupId>
            <artifactId>spring-cloud-starter-netflix-turbine</artifactId>
        </dependency>
    </dependencies>
    <build>
        <plugins>
            <plugin>
                <groupId>org.springframework.boot</groupId>
                <artifactId>spring-boot-maven-plugin</artifactId>
            </plugin>
        </plugins>
    </build>
</project>
4.2 项目配置
指定注册中心地址和聚合的项目,这里我们监控 consumer,producer 两个项目:
server:
  port: 8040
# 指定服务命名
spring:
  application:
    name: turbine
# 指定注册中心地址
eureka:
  client:
    serviceUrl:
      defaultZone: http://localhost:8010/eureka/
# 指定聚合的项目
turbine:
  aggregator:
    cluster-config: default
  combine-host-port: true
  app-config: consumer,producer
  clusterNameExpression: "'default'"
4.3 添加注解
在启动类上添加注解:
@SpringBootApplication
@EnableDiscoveryClient
@EnableHystrix
@EnableHystrixDashboard
@EnableTurbine
public class TurbineApplication {
    public static void main(String[] args) {
        SpringApplication.run(TurbineApplication.class, args);
    }
}
4.4 启动项目
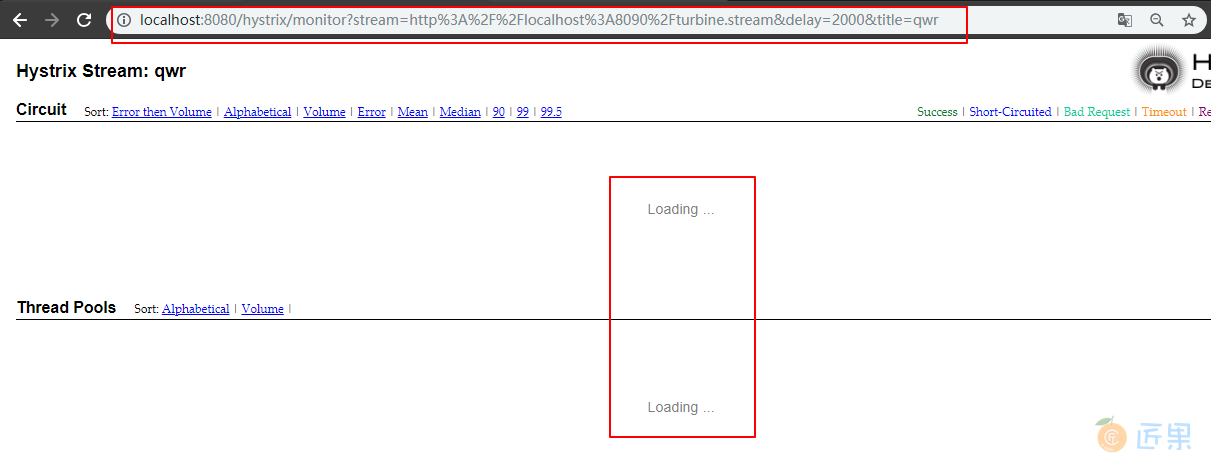
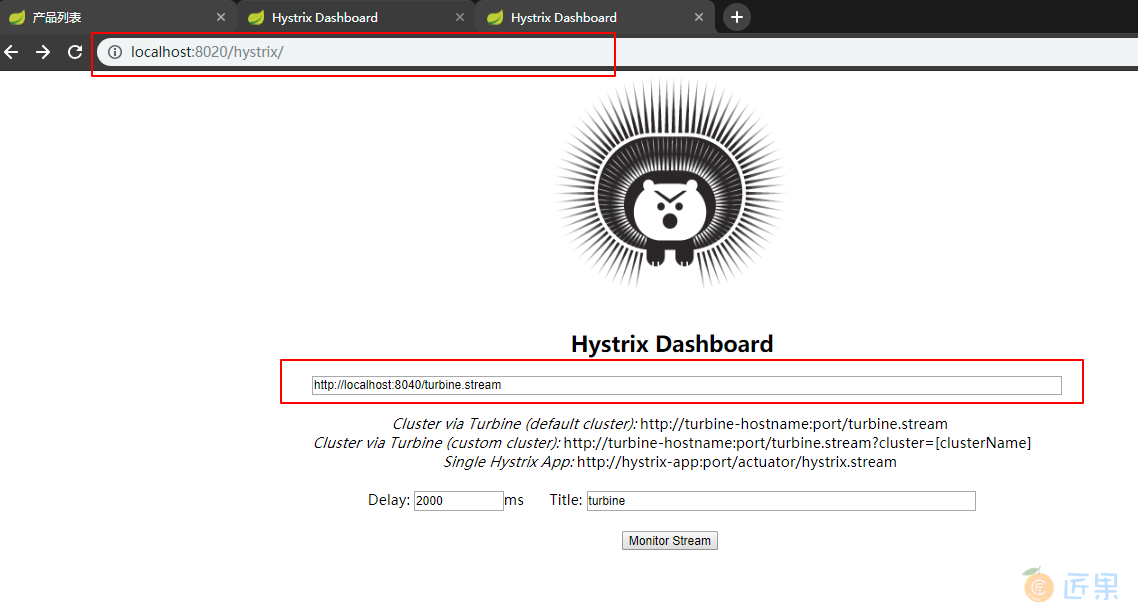
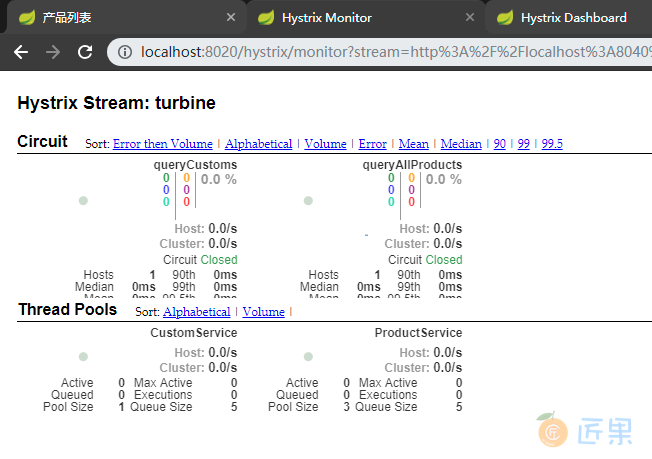
依次启动 eureka、producer、consumer、turbine 四个项目,因为 consumer 和 producer 都集成了 Hystrix ,所以可以在 localhost:8020/hystrix 或者 8030/hystrix 页面输入 http://localhost:8040/turbine.stream 来查看断路器聚合信息:
显示了不同服务单元(consumer,producer)的多个断路器信息:
五、常见问题
在整合过程中可能出现的一些问题如下:
5.1 无法访问监控页面
一般是端点链接输入不对,在 F 版本的 Spring Cloud 中,输入监控的端点链接是 http://localhost:8030/actuator/hystrix.stream ,中间是有 /actuator/(之前版本的没有)。其次是可能没有暴露端点,暴露端点有两种方式,一种是我们在上文中提到的基于配置的方式:
management:
  endpoints:
    web:
      exposure:
        # 需要开启 hystrix.stream 端点的暴露 这样才能获取到监控信息 * 代表开启所有可监控端点
        include: "*"
另一种基于代码的方式,示例如下:
 @Bean
public ServletRegistrationBean getServlet() {
    HystrixMetricsStreamServlet streamServlet = new HystrixMetricsStreamServlet();
    ServletRegistrationBean registrationBean = new ServletRegistrationBean(streamServlet);
    registrationBean.setLoadOnStartup(1);
    registrationBean.addUrlMappings("/actuator/hystrix.stream");
    registrationBean.setName("HystrixMetricsStreamServlet");
    return registrationBean;
}
这两种方式二选一即可,就算是采用代码的方式,还是建议将地址设置为 /actuator/hystrix.stream,而不是原来的 hystrix.stream,因为 Turbine 默认也是从 /actuator/hystrix.stream 去获取信息。
5.2 页面一直 Loading 或者访问端点页面一直出现 Ping
这种情况是熔断器所在的方法没有被调用,所以没有产生监控数据,不是整合问题,这时候调用一下熔断器所在方法即可: